I Took the Summer Off From Coding. It Didn't Last.
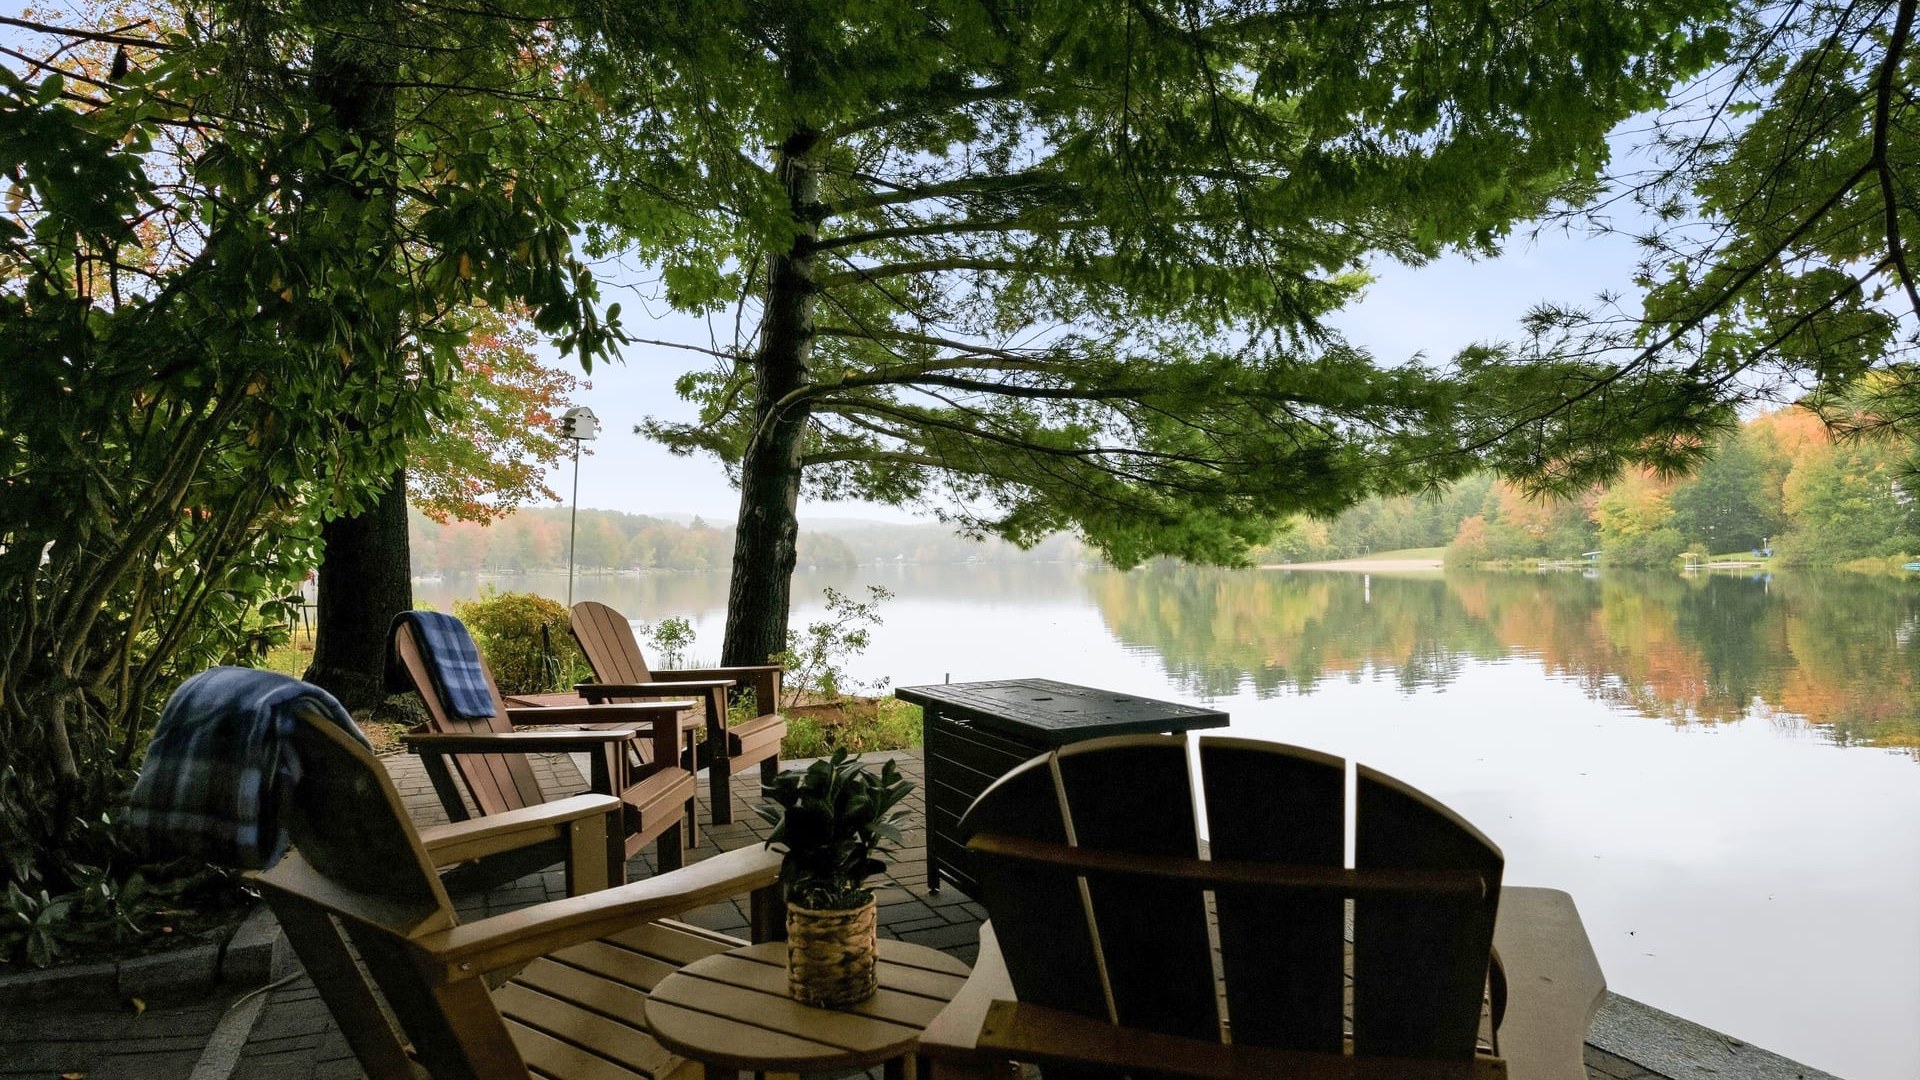
My property manager’s onboarding questionnaire asked a simple question: what are your favorite activities to do at or around the cottage? Most owners write a sentence. I wrote a website.
Some background. I took this summer off from coding to renovate my summer cottage on Locke Lake in Barnstead, New Hampshire. The plan was to fix it up and rent it out to cover the upkeep. I didn’t want to deal with guests, cleaners and routine maintenance myself, so I hired a professional property manager to market and run the rental. Their onboarding process included a detailed questionnaire, and that one question stopped me.
For me the answer has always been biking, hiking, backcountry skiing, snowshoeing and kayaking off the dock. For those of you who don’t know me, I’m an avid cyclist and a fan of just about any endurance sport. I believe the riding and hiking in New Hampshire’s Lakes Region are some of the best anywhere, and several of my favorite routes start right at the back door. A sentence on a form wasn’t going to do them justice. What I really wanted was a set of curated routes guests could download straight to their bike computers.
So much for the summer off.
Two Days
I created a new project in GitHub and started vibing with Claude Code. I told it I wanted a website showing biking, hiking and backcountry skiing routes from the cottage, with a way to download each route to a Garmin or other sports device. I went with Next.js on Vercel, the same setup I use for my other projects.
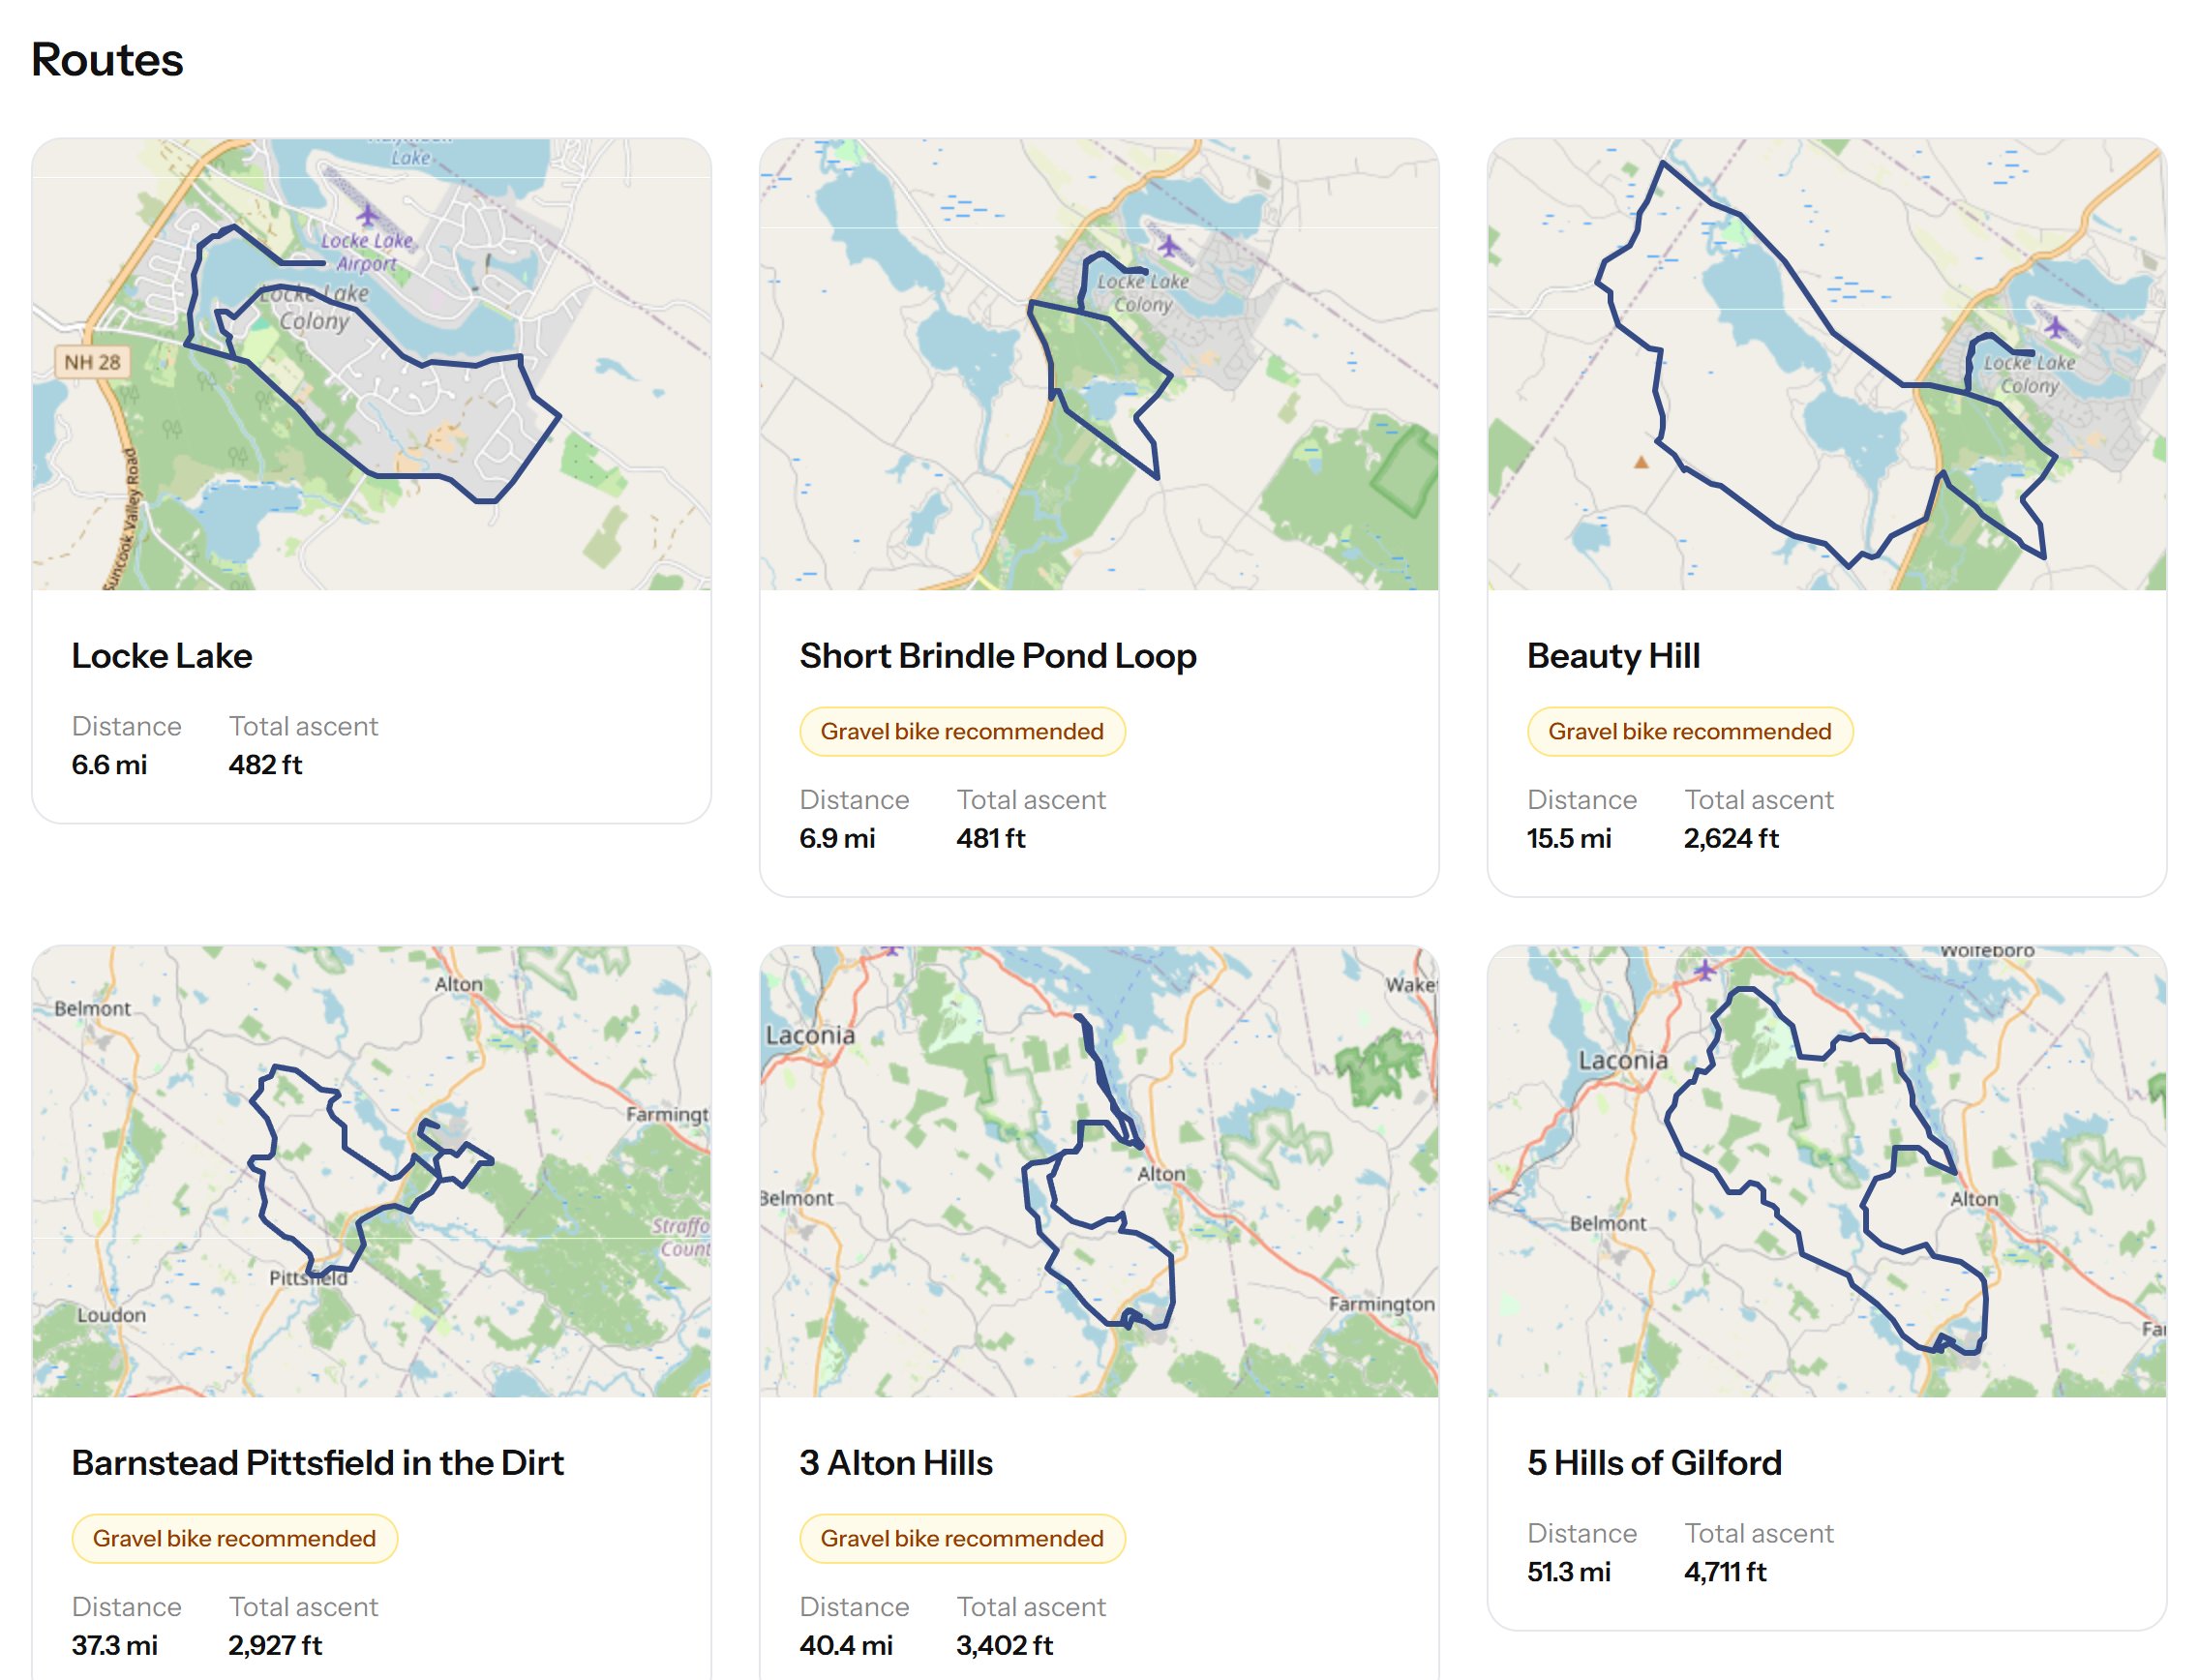
For the routes, I went through my own recorded rides in Garmin Connect and downloaded the GPX files (TCX for the older devices). Claude turned each one into a route page with a map and a thumbnail, and built a basic content management system so I could curate the site myself.
Two days later, the site was up and running.
What a Cyclist Actually Wants
Then I thought about what I’d want to see on a site like this as a cyclist, beyond a short description of the ride:
- Length
- Total ascent
- Climb information
- Surface (paved or dirt)
- Photos
- Places to refuel and rehydrate along the way
Length and total ascent were easy, since they come straight out of the GPX file. The rest took more thought.
Tour de France for Back Roads
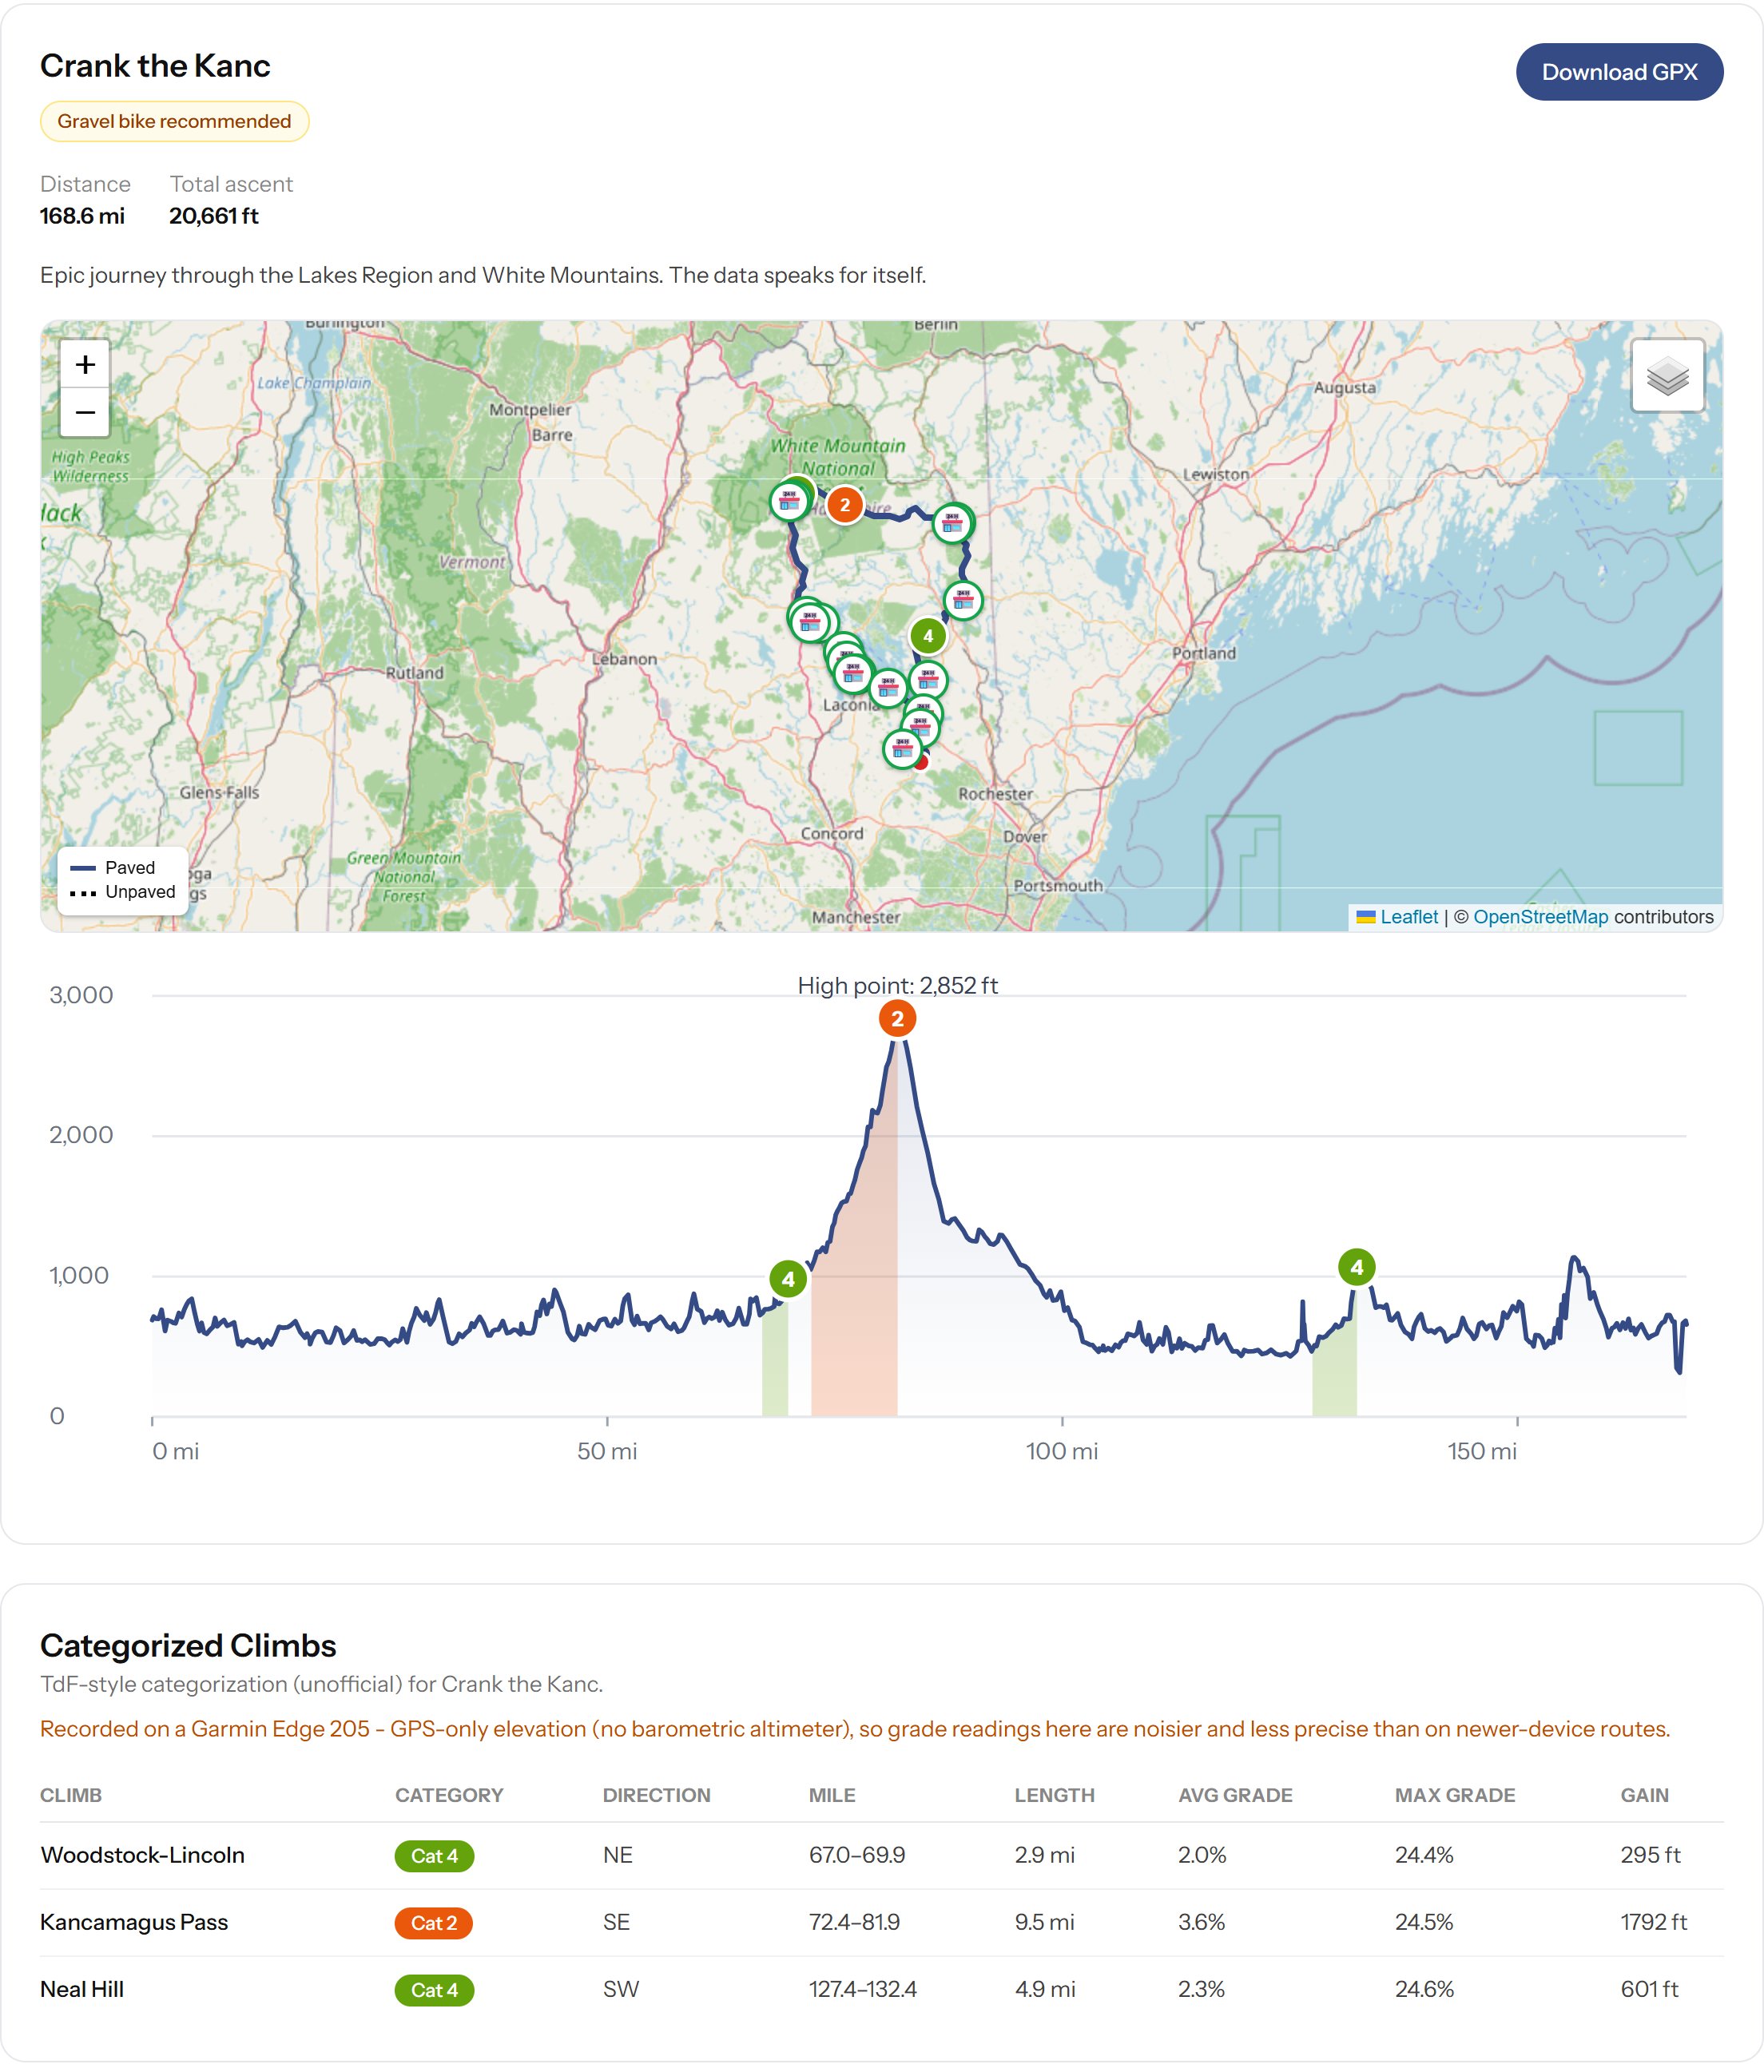
To describe the climbs, I couldn’t think of anything better than the Tour de France rating system. I had Claude research how the Tour categorizes climbs, from Category 4 up to HC, and apply those rules to every route. Each route page now has an elevation chart with the climbs marked on it. I can even name them. The Kancamagus Pass on Crank the Kanc gets its proper name.
For surfaces, Claude pulls road data from OpenStreetMap, and dirt roads show up as dashed lines on the map. That matters a lot in New Hampshire, where a perfectly good road can turn to gravel without warning.
Photos were the part I’d been dreading. Searching my iPhone for ride photos and trying to remember where I’d taken them was painful. So I let Claude loose on my photo library. It scans my iCloud Photos for pictures whose GPS location falls along one of my routes, adds them to that route’s page, and drops a marker on the map where each was taken.
For refueling stops, Claude uses the Google Places API to find convenience stores, cafés and the like along each route and marks them on the map.
Automation only gets you so far, though. Some photos were redundant, and some “stores” were a marina that happened to sell gas. So I added curation for both, which lets me hide anything that doesn’t belong.
My Old Garmin Lied
I had all of this automated and running quickly. Then I started reviewing routes and found all kinds of quirks.
My older bike computers and watches don’t have barometric altimeters, so they estimate elevation from GPS alone, and GPS elevation is noisy. The result was phantom spikes, impossible gradients, and climbs that didn’t exist. I had Claude filter out the obvious bad data points and smooth the noise. For some of the older rides, it threw out the device’s elevation entirely and pulled elevation from a public terrain dataset instead.
Crank the Kanc was the worst offender. It’s a 168-mile day over the Kancamagus Pass, and my old Garmin Edge 205 gave up at mile 145, so I switched to my watch for the rest of the ride. The watch’s elevation was so bad that the last 23 miles produced climbs that weren’t there, including one stretch that read as a 59.7% grade. Trust me, there is nothing in New Hampshire that steep. Claude now ignores the elevation after the device swap.
The Kancamagus Pass itself had the opposite problem. It’s one long climb of about 1,800 feet, but a few short flat stretches on the way up were enough for the site to split it into three small, unremarkable climbs. It took some tuning to get it rated as the one long climb it is.
533 Rides
All in all, it was a pretty amazing experience, and the site had become a great way to document many of my most memorable rides. Then I noticed rides missing. Garmin Connect wasn’t showing everything I knew I’d done.
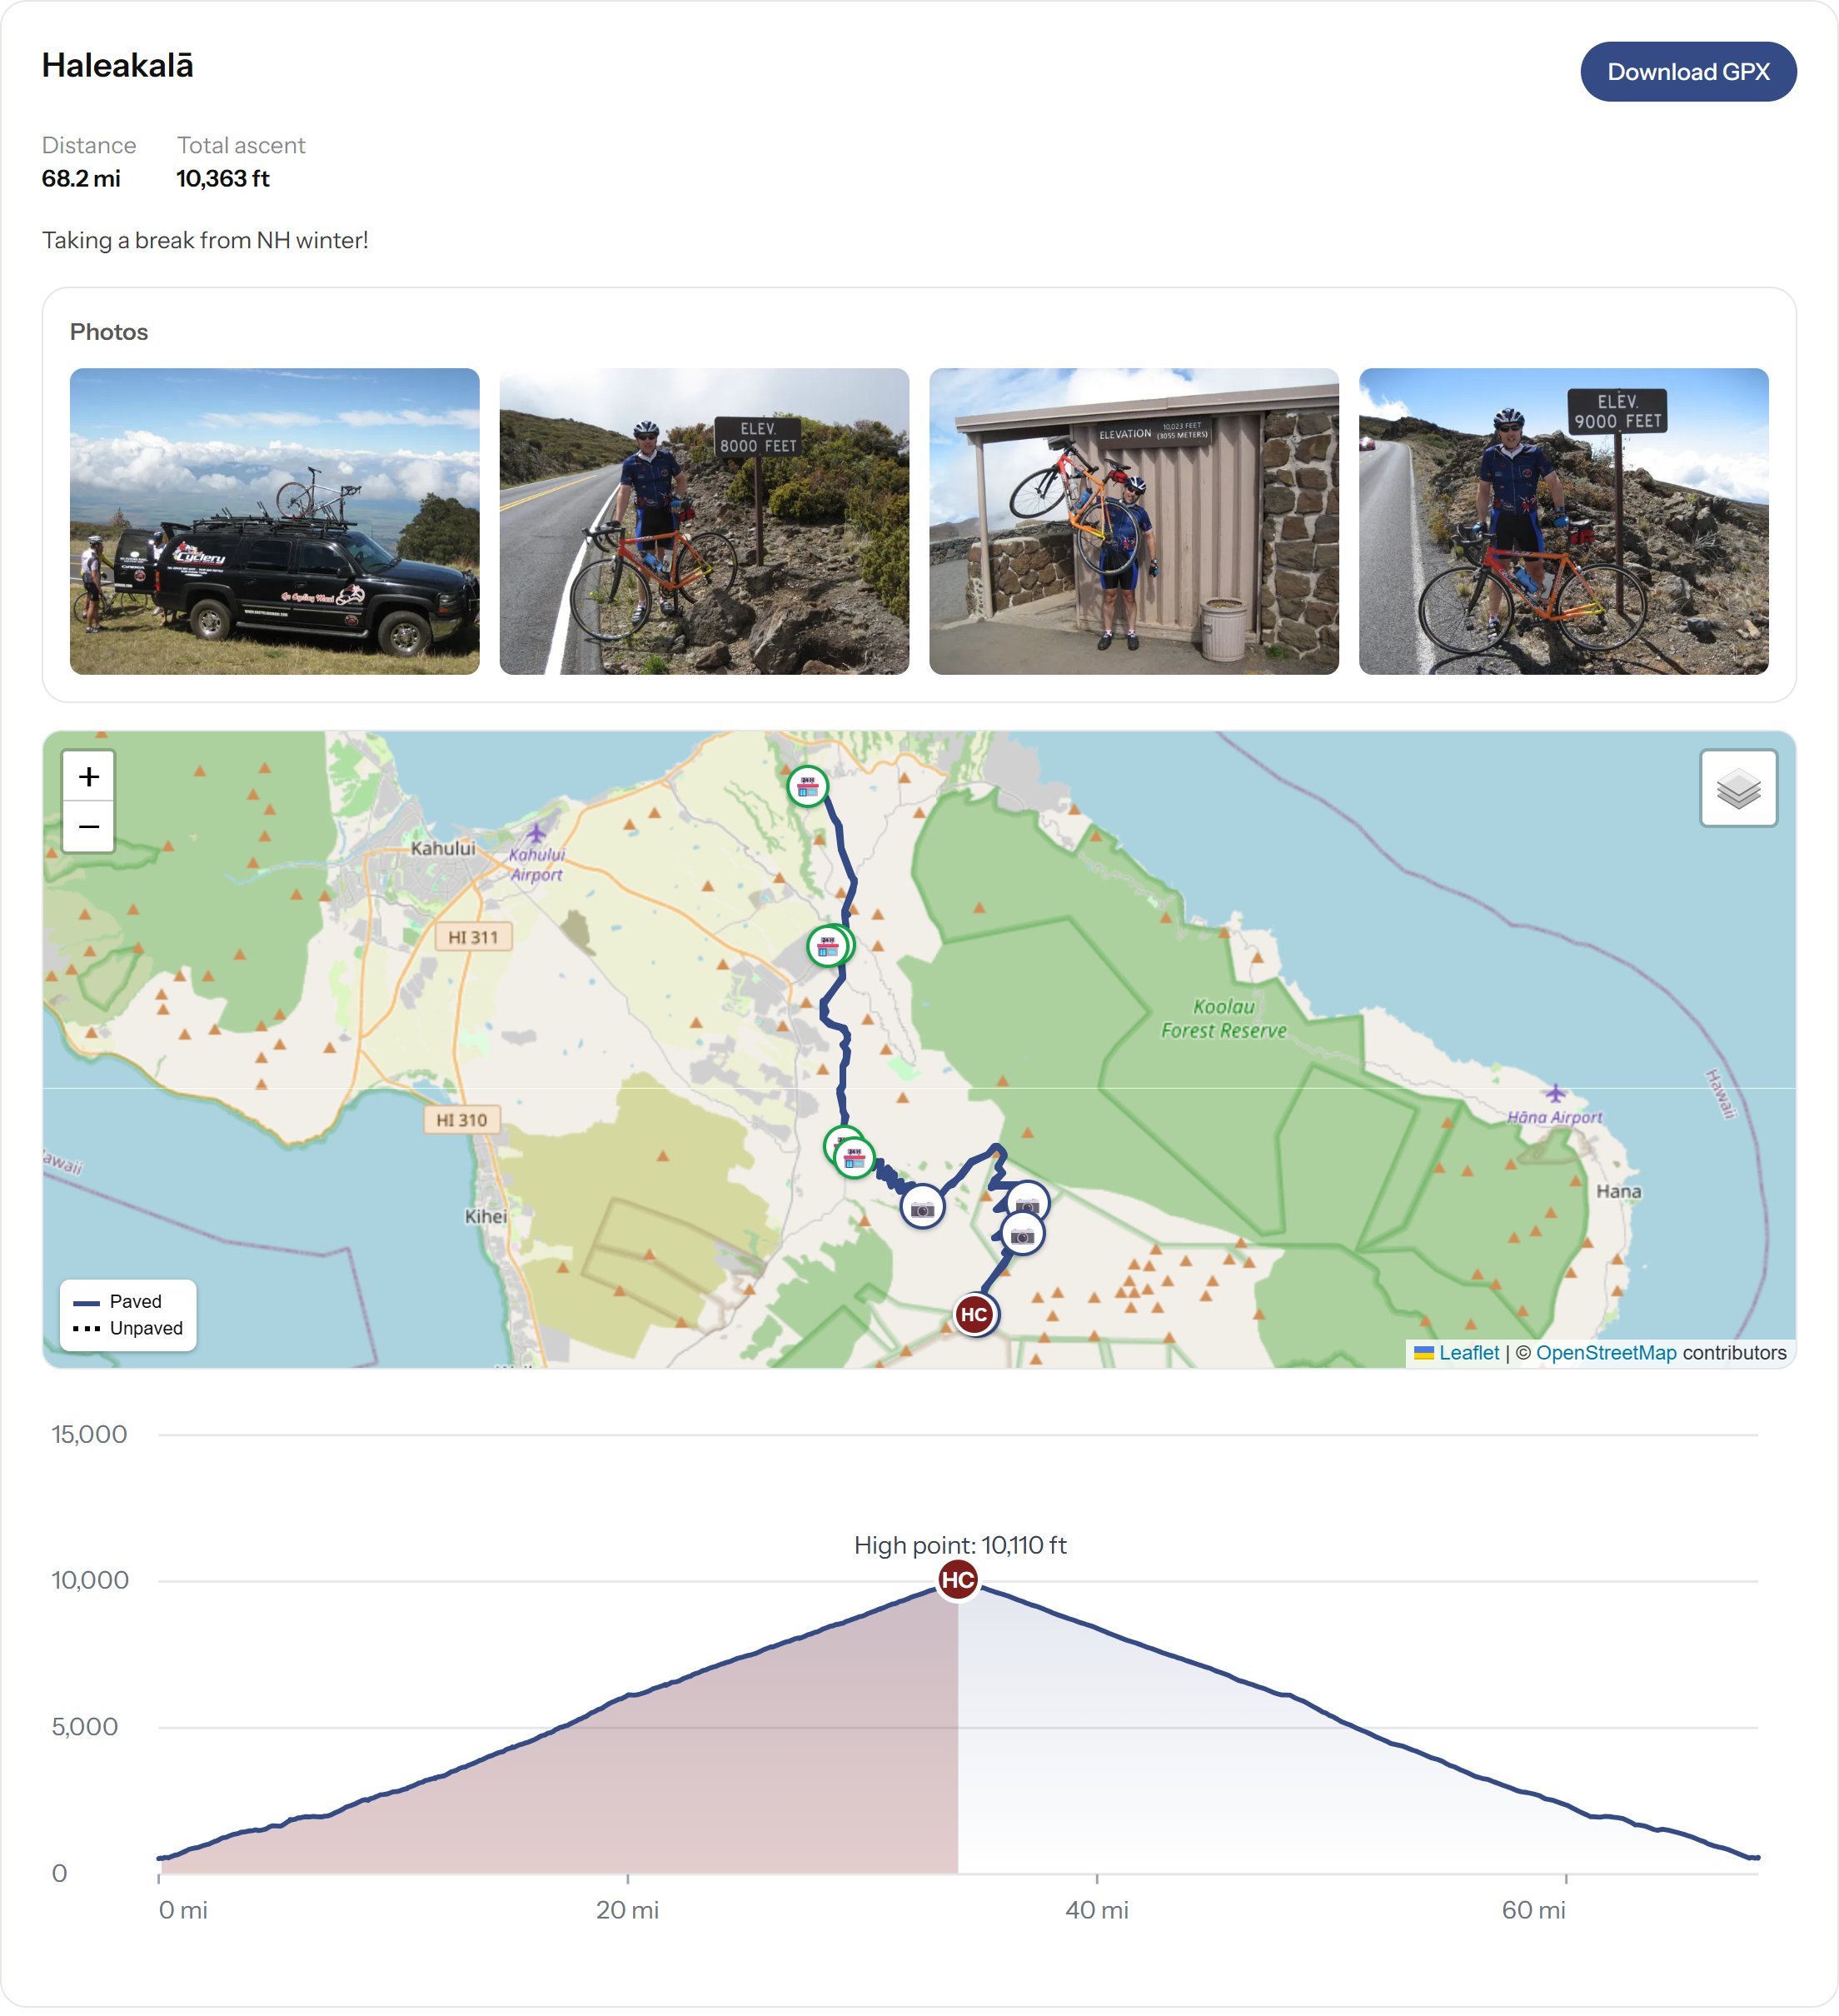
So I requested a full export of my raw data from Garmin. They warned it could take up to 30 days. It took about a week. Claude loaded it into an admin page on the site where I could drill into each ride and view its map. There were several thousand rides, most of them years of recorded bike commutes, so I had Claude dedupe them. It whittled them down to 533 unique routes, and from there I could filter and sort until I found the rides I knew were missing. Along the way I rediscovered some of the more iconic rides, like Haleakalā, and added them for fun.
Then I wanted to add some hikes and backcountry ski routes that I’d recorded on my Apple Watch rather than a Garmin. I exported the data from Apple Health and pulled those in as well.
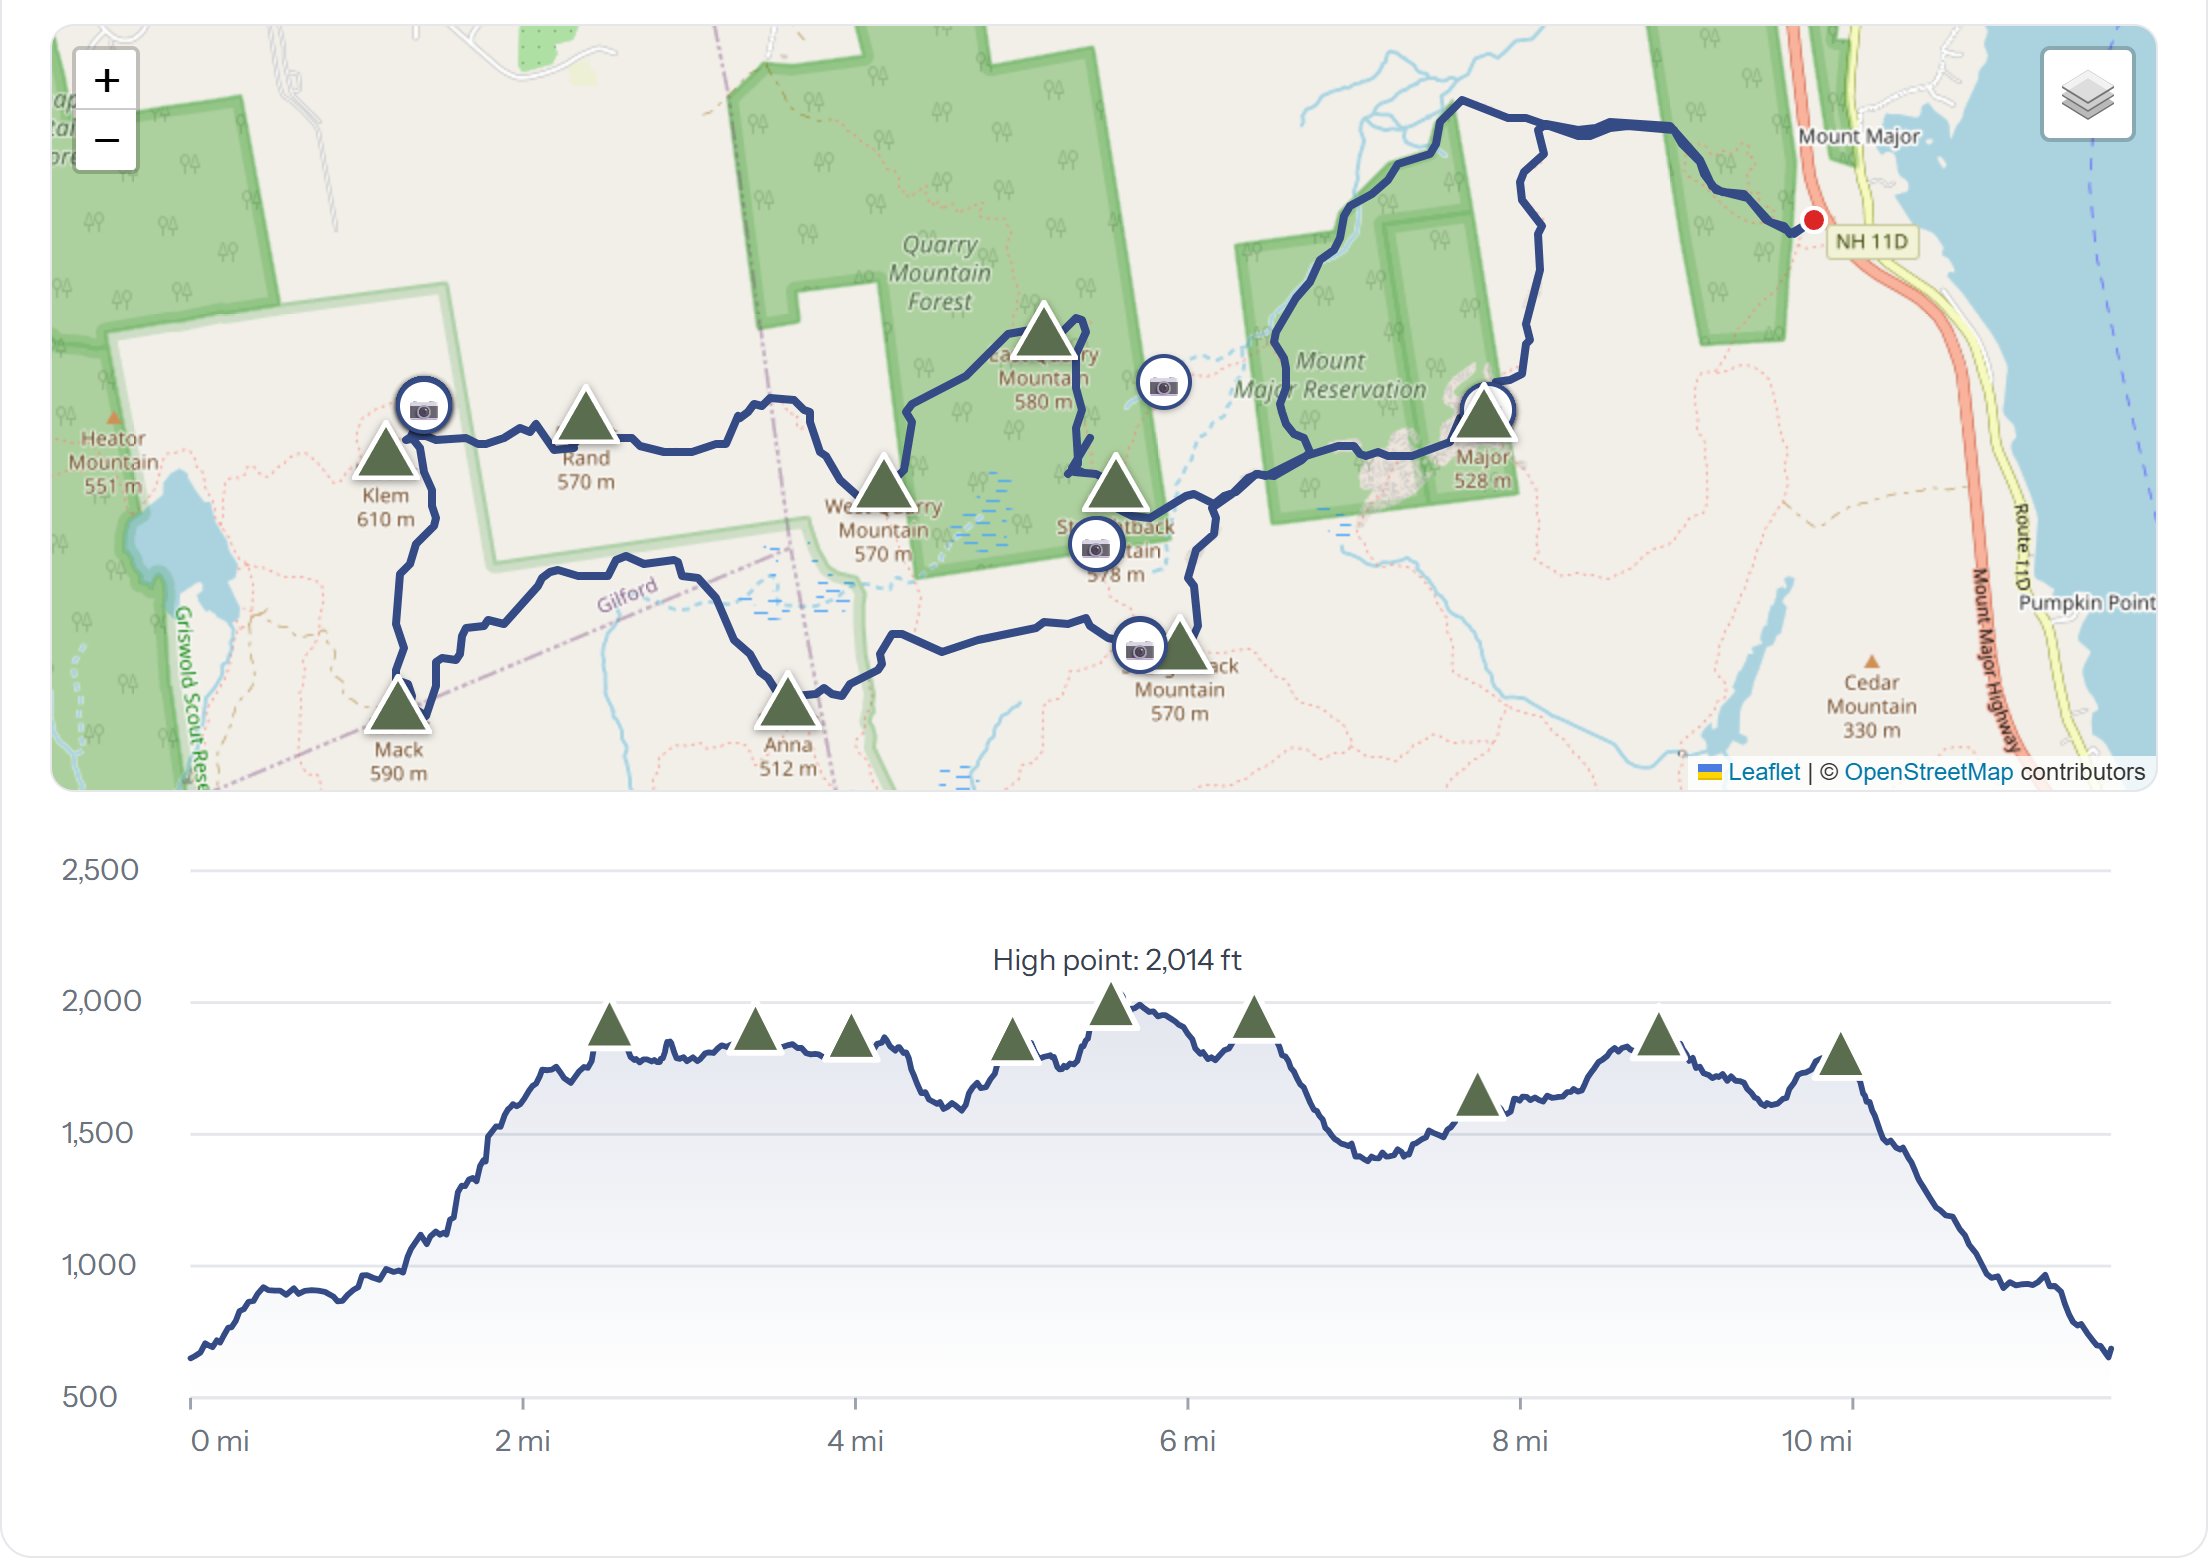
Sadly, a lot of older rides and hikes are lost for good. They happened before I had GPS on my wrist or my handlebars, and the photos are stuck on cameras from before I switched to an iPhone. But what’s left has become a great record of my passion for the outdoors.
Built by One Person
I keep coming back to how incredible AI-assisted coding is. One person, a handful of days, and you have a fairly sophisticated app: maps, climb ratings, surface detection, photos matched by GPS, a data pipeline for thousands of rides, and an admin system to curate it all. A few years ago, that would have been a team and a budget.
Anyone interested can see the site at penguinhouse.us.
Anyone have thoughts on additional features to add?